San Diego Padres: Tyson Ross Stopped Missing Bats
By Nick Stevens

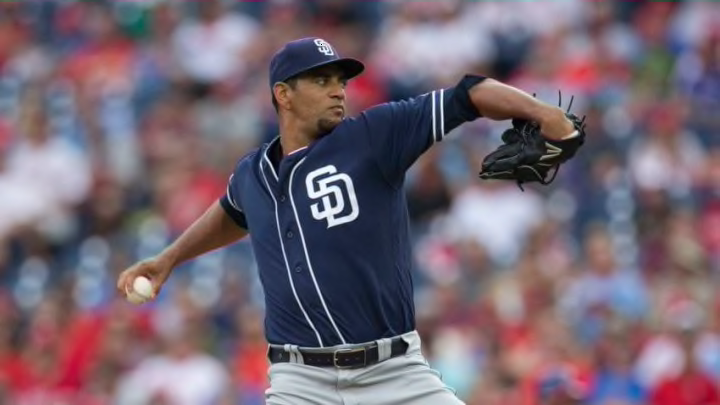
San Diego Padres RHP Tyson Ross has been on the decline.
For much of the early part of 2018, whenever Tyson Ross took the mound, San Diego Padres fans found comfort in knowing their best pitcher had the ball in his hand. Clayton Richard has been up and down all season, Eric Lauer struggled with his first few starts, Bryan Mitchell was vomit-inducing, and Luis Perdomo was so bad he was sent to El Paso. However, Tyson Ross remained solid.
Ross made five starts in April, limiting hitters to a .216 average and posting a 1.15 WHIP. He was striking out more than 25% of hitters and recorded a 3.06 FIP.
The numbers looked similar in his six May starts, maintaining the .216 average against him, holding steady at a 1.19 WHIP, and a 3.52 FIP. The strikeout rate also continued to hover around 25% in 36 innings.
Since May, Ross and his production have quickly declined, resulting in a disastrous month of July (still one more scheduled start at the time of this writing).
Just how bad has this month been for Tyson Ross? Across 18.1 innings, opponents have worked a 9.33 ERA, .293 average, .391 OBP, .608 SLG, and a .418 wOBA.
What has led to the decline of Tyson Ross?
There doesn’t appear to be anything major going on with Ross but there are a variety of smaller factors that could help explain the struggles. Let’s start with one of the first signs of trouble, velocity. According to Brooks Baseball data, Ross was throwing his fastball at an average of 92.2 mph. That number has since dropped to 91.2 mph in the month of July.
What about pitch usage? His best pitch is his slider, yet Ross is using it less and less.
Meanwhile, his fastball usage is up to 49.1% in July. Hitters are loving the Tyson Ross fastball, posting a .345 average and .470 wOBA off of it. Compare that to his slider, which batters are hitting .257 against with a .391 wOBA (both numbers are from July).
As Ross throws his fastball more and keeps it in the zone (nearly 52% in July), hitters are chasing his slider less, when he does throw it. The chase rate on the slider has dropped from 43% in June to 30% in July.
More from Friars on Base
- Padres fighting with hated rival to sign quality veteran relief pitcher
- Jurickson Profar free agency update likely rules out Padres reunion
- Fernando Tatis Jr. may not take to outfield move after Xander Bogaerts addition
- Padres News: Fernando Tatis Jr. trade rumors, Seth Lugo chase, Manny Machado
- Padres barely missed out on high-end veteran starting pitcher
The extremely high batting averages against Ross aren’t helped by his significant drop in his ability to miss bats. After producing a swing and miss rate of 24-25% through May, he’s down to just 19-20% now. The swing and miss on his more often used fastball currently sits at just 8%.
There’s also the fact that Ross may be overworked and tired. He threw over 100 innings just three times, from 2013-2015 and then threw five innings in 2016 and 49 in 2017. He has 113 innings under his belt this season, quickly approaching the third-most innings he’s logged in a single season in his career.
Either way, Tyson Ross is clearly struggling and there doesn’t appear to be any signs of a turnaround.
Next. Five Biggest Trade Chips The Padres Have. dark
Will we see Ross in a San Diego Padres uniform after the trade deadline? There are a number of teams who are actively shopping for pitching and the complete body of work from Ross this season does tell a positive story. If another team believes they can use him in a more effective way, maybe they take a chance on the low-cost pitcher.
All stats acquired from BrooksBaseball.net, Fangraphs, and Baseball Savant.