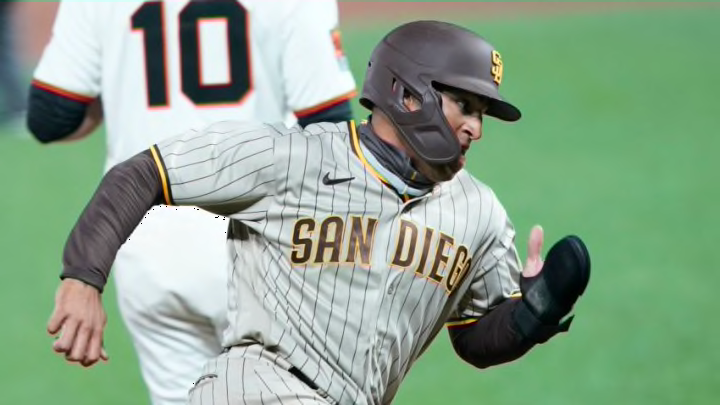
We take a look at how the San Diego Padres stack up by the numbers through the first 10 games of the season compared to the rest of the league.
The San Diego Padres got off to a hot start in this truncated MLB season but cooled off a bit over the weekend in Denver.
Regardless, this team has been very fun to watch and is certainly showing signs of improvement.
At 6-4 the Padres have the sixth-best winning percentage in baseball; although, really it’s fifth-best as the Miami Marlins have only played three games.
With the expanded postseason in 2020 that would be good enough for the Padres to be in despite being in third place in the NL West behind the Los Angeles Dodgers and a Colorado Rockies team that is how to a blazing hot start.
But let’s dive into the numbers a little and see just how the Padres have gotten it done through 10 games.
Padres Pitching Stats
The pitching staff certainly hasn’t been fantastic with a 4.70 ERA, which ranks 20th in MLB.
But the majority of the damage has come against a bullpen that has drastically underperformed with a 6.15 ERA, while the starters have an ERA of 3.45 — 10th best in MLB.
As you might a imagine, a big part of that is descrepency between the K/9 and BB/9 of the starters and bullpen.
Padres starters have a K/9 of 9.38 and a BB/9 of 2.49, while the bullpen’s K/9 is just 7.68 and their BB/9 is 3.51.
Couple that that with the fact the Padres bullpen has a BABIP of .305 and you can see why they’ve been so shaky to start the season.
Padres Hitting Stats
It’s really the offense that has carried this team through the first 10 games as they lead the league in runs per game.
Top 10, runs per game:
— Ken Rosenthal (@Ken_Rosenthal) August 3, 2020
SD 5.90
HOU 5.78
ATL 5.70
MIA 5.67
NYY 5.63
CHC 5.56
CWS 5.56
LAD 5.40
COL 5.38
CIN 5.22
Bottom 10
CLE 2.60
AZ 2.70
PIT 3.33
OAK 3.33
TEX 3.38
WAS 3.43
TOR 3.57
STL 3.60
NYM 3.80
DET 3.80
Note: Marlins have played only three games
However, it’s not because they’ve been getting a lot of hits as they’re hitting just .237 as a team, which ranks 17th in MLB.
But with a BB% of 11.7 percent, they have a .335 OBP, which is 11th best in baseball.
And they also lead the league with 14 stolen bases, so they’re finding ways to get runners on and get them in without having to pick up a bunch of hits.
Now, of course, we’d like to see them hit a little more to feel good about their long-term success. But it’s nice to know they can get it done in multiple ways.
Something that’s awfully encouraging is that the Padres have the second-best hard-hit percentage in baseball at 48.6 percent — only behind the big boppers in the New York Yankees lineup.
Perhaps that means more hits are coming for the Padres and we’ll start to see them couple their great plate discipline with more hits.
It’s certainly been an encouraging first 10 games for the Padres, but as you can see, there are still areas they need to improve in if they’re going to make some noise in 2020.
