Why the San Diego Padres offense is struggling

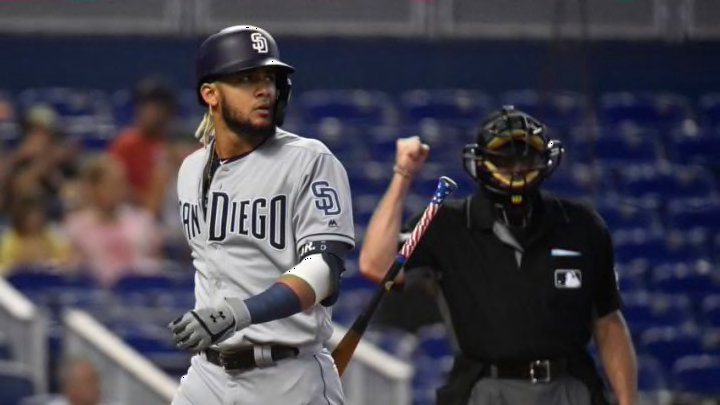
MIAMI, FL - JULY 18: Fernando Tatis Jr. #23 of the San Diego Padres walks back to the dugout after striking out in the first inning against the Miami Marlins at Marlins Park on July 18, 2019 in Miami, Florida. (Photo by Eric Espada/Getty Images)
1 of 4
Next
MIAMI, FL – JULY 18: Fernando Tatis Jr. #23 of the San Diego Padres walks back to the dugout after striking out in the first inning against the Miami Marlins at Marlins Park on July 18, 2019 in Miami, Florida. (Photo by Eric Espada/Getty Images)
MIAMI, FL – JULY 18: Fernando Tatis Jr. #23 of the San Diego Padres walks back to the dugout after striking out in the first inning against the Miami Marlins at Marlins Park on July 18, 2019 in Miami, Florida. (Photo by Eric Espada/Getty Images) /

Does their run differential upset you? Or that they can’t score consistently? Here’s why the San Diego Padres offense has been less than stellar this season.

Compared to the last eight seasons, this San Diego Padres offense is the most exciting one to watch by a long shot.

That said, it won’t be enough to spring the Friars into a playoff spot, at least not at its current rate. Their method of manufacturing runs is unsustainable, inconsistent, and downright frustrating. There’s a reason why they’re ranked in the bottom ten in the league for most offensive categories.

That’s right. The Padres are ranked 24th in runs scored, 20th in run differential, 27th in total hits, 24th in RBIs, 26th in batting average, and 24th in on-base percentage. I guess that’s not very surprising considering their record.

They are, however, ranked 11th in home runs and 17th in slugging percentage. So what gives?

In this post, we’ll attempt to take a deeper dive into why the Padres can’t seem to produce, especially when it’s most important. Of course there are many reasons beyond the ones we discuss here, including management, defense, and downright bad luck that can lead to an unproductive offense. We try to tackle the ones that are most apparent though.

As with several of these analytical articles, this one will be somewhat statistically-heavy. Feel free to check out FanGraphs and Baseball-reference for detailed explanations on certain statistics and how they’re calculated.

Let’s commence!
DENVER, COLORADO – JUNE 14: Hunter Renfroe #10 of the San Diego Padres hits a 2 RBI home run in the 12th inning against the Colorado Rockies at Coors Field on June 14, 2019 in Denver, Colorado. (Photo by Matthew Stockman/Getty Images)
DENVER, COLORADO – JUNE 14: Hunter Renfroe #10 of the San Diego Padres hits a 2 RBI home run in the 12th inning against the Colorado Rockies at Coors Field on June 14, 2019 in Denver, Colorado. (Photo by Matthew Stockman/Getty Images) /

Home run happy

Home runs are one of the most exciting plays in baseball. The more the merrier.

That said, relying too heavily on homers to score runs is unsustainable long-term, and the San Diego Padres offense is proving that right now.

Of the 475 runs scored this season, 55.2% of those is thanks to the home run. That’s calculated with the following formula: (Runs scored off of balls not in play) / (Total runs scored).

Scoring runs via homers isn’t inherently bad — when you look at the top five teams in the league in runs scored, you get the following:

  1. Boston Red Sox: 640 total runs scored, 45% via home run
  2. New York Yankees: 619, 52.2%
  3. Minnesota Twins: 617 runs, 54.3%
  4. Los Angeles Dodgers: 603 runs, 52.7%
  5. Atlanta Braves: 589 runs, 49.7%

So, what’s the problem with home runs? Nothing. The problem lies in runs scored from balls in play. Clearly, the Padres offense is swinging for the fences, not for base hits. They rank 19th in the league with a .294 BAbip.

Simply put, the Padres are hitting dingers and dingers only. Their home run numbers are on par with the the top five scoring teams, but their number of runs from balls in play is severely lower:

  1. Boston Red Sox: 354 runs scored via balls in play
  2. New York Yankees: 296
  3. Minnesota Twins: 282
  4. Los Angeles Dodgers: 285
  5. Atlanta Braves: 296
  6. San Diego Padres: 213

Obviously, the Friars are going to have less runs scored than the top five teams considering they’re 50-58. The issue is that their ratio of runs scored via balls in play vs. not in play is much worse than better teams.

Ultimately, I believe this problem arises from the Padres inability to get people on base, whether via walks or runs. The Padres rank 24th in the league in OBP while the middle and bottom of the lineup is inconsistent and unreliable. A few players try to carry the team, and since others can’t drive them in if they get on base, they feel the need to hit dingers and score runs themselves.

Which brings us directly to our next point.

SAN DIEGO, CA – JUNE 29: Manny Machado #13 of the San Diego Padres, center, celebrates with Fernando Tatis Jr. #23, left, as Eric Hosmer #30 looks on after Machado hit a solo home run during the second inning of a baseball game against the St. Louis Cardinals at Petco Park June 29, 2019 in San Diego, California. (Photo by Denis Poroy/Getty Images)
SAN DIEGO, CA – JUNE 29: Manny Machado #13 of the San Diego Padres, center, celebrates with Fernando Tatis Jr. #23, left, as Eric Hosmer #30 looks on after Machado hit a solo home run during the second inning of a baseball game against the St. Louis Cardinals at Petco Park June 29, 2019 in San Diego, California. (Photo by Denis Poroy/Getty Images) /

Top-heavy lineup

The San Diego Padres offense is powered by a few fantastic hitters and dragged down by several sub-par players.

The heavy hitters are obvious — Eric Hosmer is slashing .282/.333/.442 while Manny Machado is hitting .277/.347/.511.

Fernando Tatis Jr. boasts a stat line of .329/.391/.601 and will probably take over the Padres leaderboard after another month of plate appearances.

The drop off after that is pretty steep.

For those with more than 300 plate appearances, Franmil Reyes was next in line with a .255/.314/.536 slash line. He was also responsible for 16.5% of the team’s home runs, tied for 10th in the MLB with 27 long balls.

Surprisingly, Reyes also led the team in xBA with .273; unsurprisingly, he also led the team with an xwOBA of .374. While his production curbed a bit after the All-Star break, he was a big contributor all season long. As everyone now knows, Reyes was traded to the Cleveland Indians so he’s no longer contributing to the Padres offense.

Related Story. Why the three-way trade helps, and hurts, the Padres. light

If we lower the number of plate appearances to 250, Manuel Margot would have the next best line of .246/.321/.385, and that looks like a decent fall from Machado. Overall, Greg Garcia is the best of the rest with a .264 BA, but as a utility player he’s only had 223 plate appearances.

He also has a .329 wOBA, which is 4th best on the team behind Tatis Jr., Machado, and Hunter Renfroe, coupled with a 2.04 K/BB ratio. One has to wonder why he doesn’t start more.

Look, Tatis, Machado, and Hosmer are at the top of the lineup for a reason — put your best players first so they can get more at-bats. However, the rest of the lineup needs to produce if the Padres want get out of this offensive slump. Moving Hosmer to the five-hole might be good for his confidence as well as getting a higher-percentage hitter further down the lineup.

There’s also hope that players like Luis Urías and Wil Myers will pick themselves up and contribute more to getting on base, which could help the heavy hitters drive in more runs consistently.

Finally, it’s the fact the Padres can’t come up big with runners in scoring position, in high-leverage instances, or other clutch situations that brings us to our last point.

SAN DIEGO, CA – JULY 27: Wil Myers #4 of the San Diego Padres reacts after striking out during the sixth inning of a baseball game against the Arizona Diamondbacks at PETCO Park on July 27, 2018 in San Diego, California. (Photo by Denis Poroy/Getty Images)
SAN DIEGO, CA – JULY 27: Wil Myers #4 of the San Diego Padres reacts after striking out during the sixth inning of a baseball game against the Arizona Diamondbacks at PETCO Park on July 27, 2018 in San Diego, California. (Photo by Denis Poroy/Getty Images) /

Not-so-clutch stats

That’s right, the Padres can’t come up with runners in scoring position, in high-leverage instances, or other clutch situations (yes, I did just repeat that for full emphasis).

Why is it that when the game is late and close, the Padres hit .199/.296/.353 but when they’re winning by four runs or more they’re crushing .295/.345/.525? Perhaps they’re swinging freely with a lead — if that’s the case, then they just need to relax!

If it feels like the team can’t pull through when it matters most, that’s because it’s statistically true. Their high-leverage averages are poor, sporting a .219 BA and .267 BAbip in the situation.

Oh, and remember all those home runs they hit? Most of them are solo shots relative to multi-run homers when compared to the top teams in the league.

Let’s look at another breakdown using the top five teams in runs scored once more. We’ll use a ratio between the number of solo home runs hit vs. the number of home runs hit with men on base.

A ratio of 1 means that a team hits multi-run homers at the same rate as single shots, so a sub-1 ratio would indicate they actually hit more multi-homers then solo shots — that’s a clear and obvious advantage compared to the other way around. Therefore, the lower the ratio the better.

More from Friars on Base

  1. Red Sox: 105 solo home runs, 64 multi-run home runs = 1.64
  2. Yankess: 100, 80 = 1.25
  3. Twins: 122, 88 = 1.39
  4. Dodgers: 106, 79 = 1.34
  5. Braves: 98, 73 =1.34
  6. Padres: 101, 64 = 1.58

Aside from the Red Sox, who just score runs in every which way, all of the top teams have a much lower solo home run: multi-run homer ratio than the Padres.

Home runs is really the only offensive category in which the Padres rank well (11th), so the fact that they have such a poor run differential and can’t produce offensively is because a lot of those come as solo shots.

Undoubtedly, this is partially because the team has such a poor OBP. Those other five teams rank in the top six of the league in OBP — more men on base plus a lot of home runs equals more multi-run homers.

Not to mention that the Friars also have 72 home runs in low- and medium-leverage situations versus 21 homers in high-leverage situations.

At this point, it should be clear that the San Diego Padres offense has problems that go beyond just a few numbers. There are a lot of things they need to work on and all of them are intertwined in the formula of offensive production.

It’s hard, and perhaps unfair, to compare the Padres to the MLB’s best; but if anything this should show where they need to improve in order to get where they want to be.

If the team intends to follow the “2020 is our year” narrative, then they must address issues like plate discipline and even the culture as it pertains to base hits vs. home runs. There are 54 games left in the season to work on these problems, and doing so would provide the chance to end on a high note — perhaps even at .500 — and have some confidence going into next season.

Next. Why the three-way trade helps, and hurts, the Padres. dark

For complete coverage of the San Diego Padres 2019 season, continue following Friars on Base all season long.

Next